


Do you know how well your retail business is performing? Are you able to identify which areas of your retail operations are driving growth and which areas need improvement?
Tracking and analyzing the right metrics is crucial to understand the health of your business.
That's why we've compiled a list of the 25 most important KPIs for retailers, along with a free retail strategy template pre-filled with KPI examples so you can start tracking them right away.

What Is A Retail KPI?
A KPI is a Key Performance Indicator that allows organizations and teams to measure their goals in order to ensure they achieve the desired results. Retail KPI is a defined and quantifiable measure that is used to assess the performance of a retail business. These are performance metrics that can be used in various ways to monitor and track retail performance.
While running a retail business and its day-to-day operations, it’s easy to lose sight of strategic goals and their progress. Business owners and executives may not even notice a gradual drop in their retail business’ performance until it’s too late to fix things.
That’s why it’s important to keep track of the essential retail KPIs. They are used to determine if your retail business is on the right path toward its goals and achieving the overall business strategy. They also help you conduct benchmarking to identify areas for improvement and create a better retail strategic plan to hit your business goals.
A great way to keep track of KPIs and visualize them in relation to the overall business strategy is through Cascade.
👉 That's why we created our Free Retail Strategy Template, for you to try out what we're all about!
When you get caught in the daily grind, your long-term goals can easily get nudged to the sidelines.
Business owners may not even notice a gradual drop in their retail business’ performance until it is too late to fix things.
That’s why it is important to keep track of essential retail KPIs. KPI stands for key performance indicator and is a form of retail metrics used to track the performance to determine if your retail business is on track towards its goals and achieving the overall strategy. They also help you conduct benchmarking to identify areas for improvement and create a better retail strategic plan to hit your business goals.
That's why we created our Free Retail Strategy Template, for you to try out what we're all about!
We've been compiling everything you need to know about KPIs as part of our KPI examples mini-series.
Retail KPI Examples
This article is part of our KPI series and it provides 18 of the most essential retail KPIs. We also added a brief description of why you may want to use each and what it can help you identify.
✨ Tip: We suggest you pick at least 2 KPIs for each of your key strategic objectives. This will help you mitigate the risk of over-relying on a single metric, which may not always be an accurate reflection of business performance. Plus, having multiple KPIs helps to ensure that the business is focused on the right outcomes, as it provides a broader picture of the interrelationships between different aspects of the business.
Retail KPIs For Understanding Sales Metrics
Sales bring in revenue so they’re one of the most important and basic metrics to track. Modern retail sales are quite complex because they can be generated through different channels and there are several factors involved.
Sales Per Square Foot
Sales per square foot is a KPI used to measure a retail store's efficiency in generating revenue relative to its retail space. Retail business owners with a physical sales area put a lot of effort into product presentation. This metric is important in measuring the effectiveness of merchandising strategies and how well a store is utilizing its retail space.
You can calculate this by dividing your net sales by the sales space. By measuring sales per square foot, you can assess the effectiveness of your merchandising strategies and make data-driven decisions to improve the layout and product offerings in your stores.
KPI Example: Increase sales per square foot by 20% by 31/08/2024
Sales Per Employee
Tracking sales per employee can help you keep track of employee performance, investment, and revenue generated by the staff. Data from this retail metric can help you make decisions regarding training, compensation, promotions, and hiring.
Formula: Net revenue/number of employees
KPI Example: Increase the number of sales per employee to 7 per day by 31/12/2024
Conversion Rate
Every customer that steps through your door or hits your site costs some money and has the potential to contribute to your revenue. It’s important to keep track of how many visits convert to sales.
You can determine this by dividing the total number of transactions by the number of visitors. This gives you an insight into the efficacy of your sales process.
KPI Example: Increase conversion rate to 5% by 30/06/2024
These are the key performance indicators under the Sales category. If you keep track of actual sales, you know how much revenue is flowing in and can make business decisions accordingly.
📚 Recommended read: 10 Popular KPI Software Tools To Connect & Visualize Your Data (2023 Guide)
Retail KPIs For Understanding Customers' Behavior
Retail businesses depend on customers and need to keep them satisfied. Customer behavior determines just how successful a particular retail business is. Depending on your business, there are a few important customer metrics to look at.
Foot Traffic
This tracks how many people walk into your store. Foot traffic helps you determine if particular locations, ad campaigns, or products are successful. For example, if you open a branch in a different location and don’t get as much traffic as other locations do, it might not be the best place for your business.
Foot traffic provides a lot of information regarding customer behavior and response. This article does a great job of walking you through foot traffic and the various ways to measure it.
KPI Example: Increase daily foot traffic to 150 by 31/03/2024
Customer Retention Rate
Most business owners know that repeat customers are the foundation of any retail store. New customers cost the most to acquire and may not always return to make another purchase.
That’s why it’s important to track customer retention rate. It will tell you whether your business can hang onto customers and help you make the right decisions to improve retention.
Formula: Total number of customers at the end of a period divided by the total number of customers at the start. Then multiply by 100 (do not count NEW customers in that period).
Customer Satisfaction
This metric correlates with retention since the level of service and quality of goods sold will have a direct effect on retention and foot traffic. This can be measured with the NPS score and regular surveys delivered to the customers after the transaction (we've covered NPS in this article).
You can also look at your website analytics to gain a good insight into customer behavior. You can track things like bounce rates, dwell times, and other similar factors on the platform.
NPS example: On a scale of 0 to 10, how likely is it that you would recommend our company, product, or service to a friend or colleague?
KPI Example: Increase NPS by 15 by 30/09/2024
Product Return Rate
The product return rate reveals the proportion of sold items that customers subsequently return. Minimizing product returns is crucial for operational efficiency and customer satisfaction. A high return rate could signal issues with product quality, fit, or customer expectations. By addressing these concerns and lowering the return rate, you can not only decrease return-related costs but also bolster customer trust and loyalty.
KPI example: Achieve a product return rate below 7% by improving product descriptions, offering accurate sizing information, and enhancing post-purchase support
Average Sales per Customer Visit
Average sales per customer visit captures the average transaction value during a customer's visit to your store. Driving higher sales during each customer visit involves creating an appealing shopping environment and encouraging exploration. Elevating this metric requires a mix of strategic store layout, product placement, and staff training to provide personalized recommendations and assistance.
KPI example: Elevate average sales per customer visit by 15% through innovative visual merchandising, interactive displays, and personalized recommendations
Cross-Selling and Upselling Rates
Cross-selling and upselling tactics provide opportunities to enhance customer value by suggesting complementary or higher-value products. These strategies tap into customers' existing preferences, potentially boosting transaction amounts and introducing them to new offerings.
KPI example: Achieve a cross-selling and upselling rate of 25% by training staff in effective sales techniques, refining product bundling options, and leveraging customer data for tailored suggestions
Retail KPIs For Understanding Inventory Performance
Every retail business must maintain adequate inventory to support demand. Inventory is one of the most important and expensive investments for retail businesses, which is why it’s vital to keep track of it. Here are some important inventory KPIs to keep an eye on:
Inventory Turnover
You can determine inventory turnover by using this formula: The cost of goods sold divided by the average inventory.
This will give you a clear idea of how much stock is used up in a given period. The lower this figure is, the higher the risk of overstocking or deadstock. If this figure is too high, you may not be able to keep up with demand because you aren't stocking enough products.
KPI Example: Decrease inventory turnover by 5 days by 31/12/2024
Average Inventory Holding Period
Efficiently managing your inventory is crucial for maintaining a healthy cash flow. The average inventory holding period, which calculates how long products remain in stock before being sold, offers insights into inventory turnover. By strategizing around this metric, such as focusing on high-demand items, you can reduce the time products spend on shelves and allocate resources more optimally. To calculate it, divide the average inventory value by the cost of goods sold (COGS) and then multiply by 365 to convert to days.
KPI Example: Aim to cut down the average inventory holding period by 15% within the next six months
Gross Margin Return on Investment (GMROI)
GMROI gives you the real value of your inventory. It tells you how much revenue your inventory has generated over a fixed period, which can help determine if your business is making a profit.
Here’s the formula: GMROI = Gross Profit / Average Inventory Cost
As this metric specifically measures different products and categories, it’s easy to understand which products are profitable and which aren’t. Here's a detailed explanation and formulation of GMROI.
KPI Example: Increase GMROI to 2.5 by 31/10/2024
Sell-Through
When you divide the number of units sold by the starting inventory and multiply that by 100, you get the sell-through percentage.
This gives you an indication of how much of your inventory is being sold compared to how much you purchased. It will also help you understand which products are performing well and which ones may need further consideration.
KPI Example: Increase the sell-through rate by 15% by 30/06/2024
Shrinkage
Shrinkage is a key performance indicator (KPI) used in retail to measure the amount of inventory that is lost or stolen during normal business operations. It’s calculated by dividing your inventory losses by the amount of inventory you should have.
Shrinkage can occur due to a variety of reasons, including theft, administrative errors, or damages. High levels of shrinkage can have a significant impact on a retailer's bottom line, as it represents a loss of revenue that could have been reinvested in the business.
KPI Example: Reduce inventory shrinkage rate by 20% within the next quarter
Stockout Rate
The stockout rate is a metric that showcases how often customers encounter empty shelves for specific products. Consistently high stockout rates can lead to customer dissatisfaction and missed sales. Lowering this rate through effective inventory planning and reordering ensures customers can find what they want, contributing to their overall shopping experience. It's calculated by dividing the number of stockouts by the total number of opportunities a product should have been available, then multiplying by 100 to express as a percentage.
KPI example: Maintain the stockout rate below 5% for core product categories, ensuring customers can reliably find what they need
Retail KPIs For Understanding Growth Performance
Every business expands and evolves. Keeping track of growth can help you channel your resources effectively and determine where your business has the potential to improve.
There are several ways to track growth, but the most popular options are:
Online Sales vs. "Bricks and Mortar" Sales
Most businesses have started to invest in online platforms to keep up with the competition. If you have an e-commerce store and/or a brick-and-mortar store, and an online marketing campaign, this is an important retail metric to track.
You can compare the success of your online platform with your bricks-and-mortar platform and direct resources accordingly. Attribution will play a key role when measuring this KPI.
KPI example: Increase in-store sales through digital campaigns by 25% by 30/09/2024
Online to Real-Life Traffic and Conversion
It’s a good idea to track how much traffic your online marketing strategies are generating for your offline stores. This is especially crucial if you’re running a local SEO campaign.
You can keep an eye on the traffic generated by paid and organic leads, calls from click-to-call buttons, etc. This will help you optimize your campaign effectively.
KPI example: Increase click-to-call inquiries to 100 per week by 31/12/2024
Year Over Year Growth
Business owners want sustained growth over time. They want their venture to bring in more customers and increased revenue each year. Comparing the current year’s performance with the previous year’s records can help provide some insight.
If you see a downward trend in growth, you may need some remedial action to put the business back on the right track.
KPI example: Increase year-over-year revenue growth by 10% by 31/10/2024
Tracking growth metrics helps you determine your progress toward reaching your long-term goals. It also helps identify troubling trends and issues with overall performance.
Some of these trends aren’t visible while tracking smaller metrics. For example, your profits and conversion rates might be sound, but your growth KPIs might still show a downward trend. This form of visibility is essential to keeping track of your business’s true success.
Return on Assets (ROA)
Return on Assets (ROA) is a financial metric that assesses how effectively your assets are generating profits. It considers how effectively your invested resources are contributing to the bottom line. Improving ROA signifies optimal resource allocation, leading to increased profitability without necessarily requiring additional investments. It's calculated by dividing your net profit by the average total assets and then multiplying by 100 to express as a percentage.
KPI example: Increase ROA by 10% by the end of the fiscal year through improved operational efficiency
Retail KPIs For Understanding Transactional Data
It all boils down to money and business owners want to keep track of it. You want to know your profit margins, ROIs, investments, etc. Here are some KPIs that provide insight into how much money your business is earning or spending:
Gross and Net Profit
Gross profit tells a business owner how much money they’ve earned after deducting product creation and sales costs. Net profit is the profit earned after all business expenses are accounted for.
Gross profit formula: Gross profit = Total revenue - The Cost Of Goods Sold (COGS)
Net profit formula: Net profit = Gross Profit - Operating Expenses - Other Business Expenses - Taxes - Interest on Debt + Other Income
Both of them provide insight into your expenses and earnings. The data from these metrics can help you channel your resources, plan cost cuts, and introduce business strategies accordingly.
KPI example: Increase net profit by 16% by 31/12/2024
Average Transaction Value
This retail metric tells you how much people spend on your products on average. A high transaction value indicates that people are buying more products or higher-value products from your store.
A low value indicates that people are buying fewer items or lower-priced products from your store. This provides insight into the nature of how your customers interact with your business and can inform pricing and product strategies.
KPI example: Increase average transaction value by $50 by 31/08/2024
It’s also a good idea to track the cost of and profit from every sales lead. It can give you an idea of how different types of leads pass through your sales cycle, and how they translate into revenue.
This metric will also help you understand where you need to optimize your marketing campaigns to attract more leads at a lower cost.
Time to Fulfillment
Time to fulfillment quantifies the average duration between a customer's order placement and the product's shipment. Reducing the time it takes to fulfill orders translates to quicker deliveries and happier customers. Achieving this requires streamlining order processing workflows and optimizing logistics coordination.
Calculate it by summing the order processing time and shipping time for a given period, then dividing by the total number of orders.
KPI example: Decrease time to fulfillment by 20% through efficient order processing, enhanced logistics strategies, and the implementation of technology-driven solutions
eCommerce KPIs
Have you considered starting an eCommerce line of business? For a retail business, this is no longer a question, but a necessity.
Here are three important eCommerce KPIs that you should be tracking:
Cost per Acquisition (CPA)
CPA is the amount of money you spend on marketing and advertising to acquire a new customer. This metric is important because it helps you understand the cost of acquiring new customers and determine the profitability of your marketing campaigns.
KPI example: Reduce the CPA by 15% within the next quarter
Cart Abandonment Rate
Cart abandonment rate is the percentage of customers who add items to their shopping cart but leave the website before completing the purchase.
This metric is important because it provides insights into the customer experience and can help you identify barriers to purchase. By improving the checkout process and reducing the cart abandonment rate, you can increase sales and revenue.
KPI example: Decrease cart abandonment rate by 10% within the next quarter
Customer Lifetime Value (CLV)
CLV is the total amount of money a customer is expected to spend on your products or services over the course of their lifetime.
This metric is important because it helps you understand the value of your customers and can help you make data-driven decisions around customer retention and loyalty programs.
KPI example: Increase CLV by 20% within the next six months
✨Bonus: Are you building your e-commerce strategy? Get your free template.
These examples of retail KPIs should help give guidance on some common KPIs you might use to track or reverse engineer the key business objectives of your retail organization.
How to Track Retail KPIs With Cascade?
Cascade is the ultimate strategy execution platform that empowers retail businesses to execute their strategies flawlessly. Our powerful tool comes with a range of features, including extensive KPI dashboards, real-time data integration, and analytics capabilities.
Whether you’re an executive manager, portfolio manager, or operations manager, Cascade provides the tools you need to make data-driven decisions and achieve your goals for your retail business.
Here’s how you can track KPIs in Cascade:
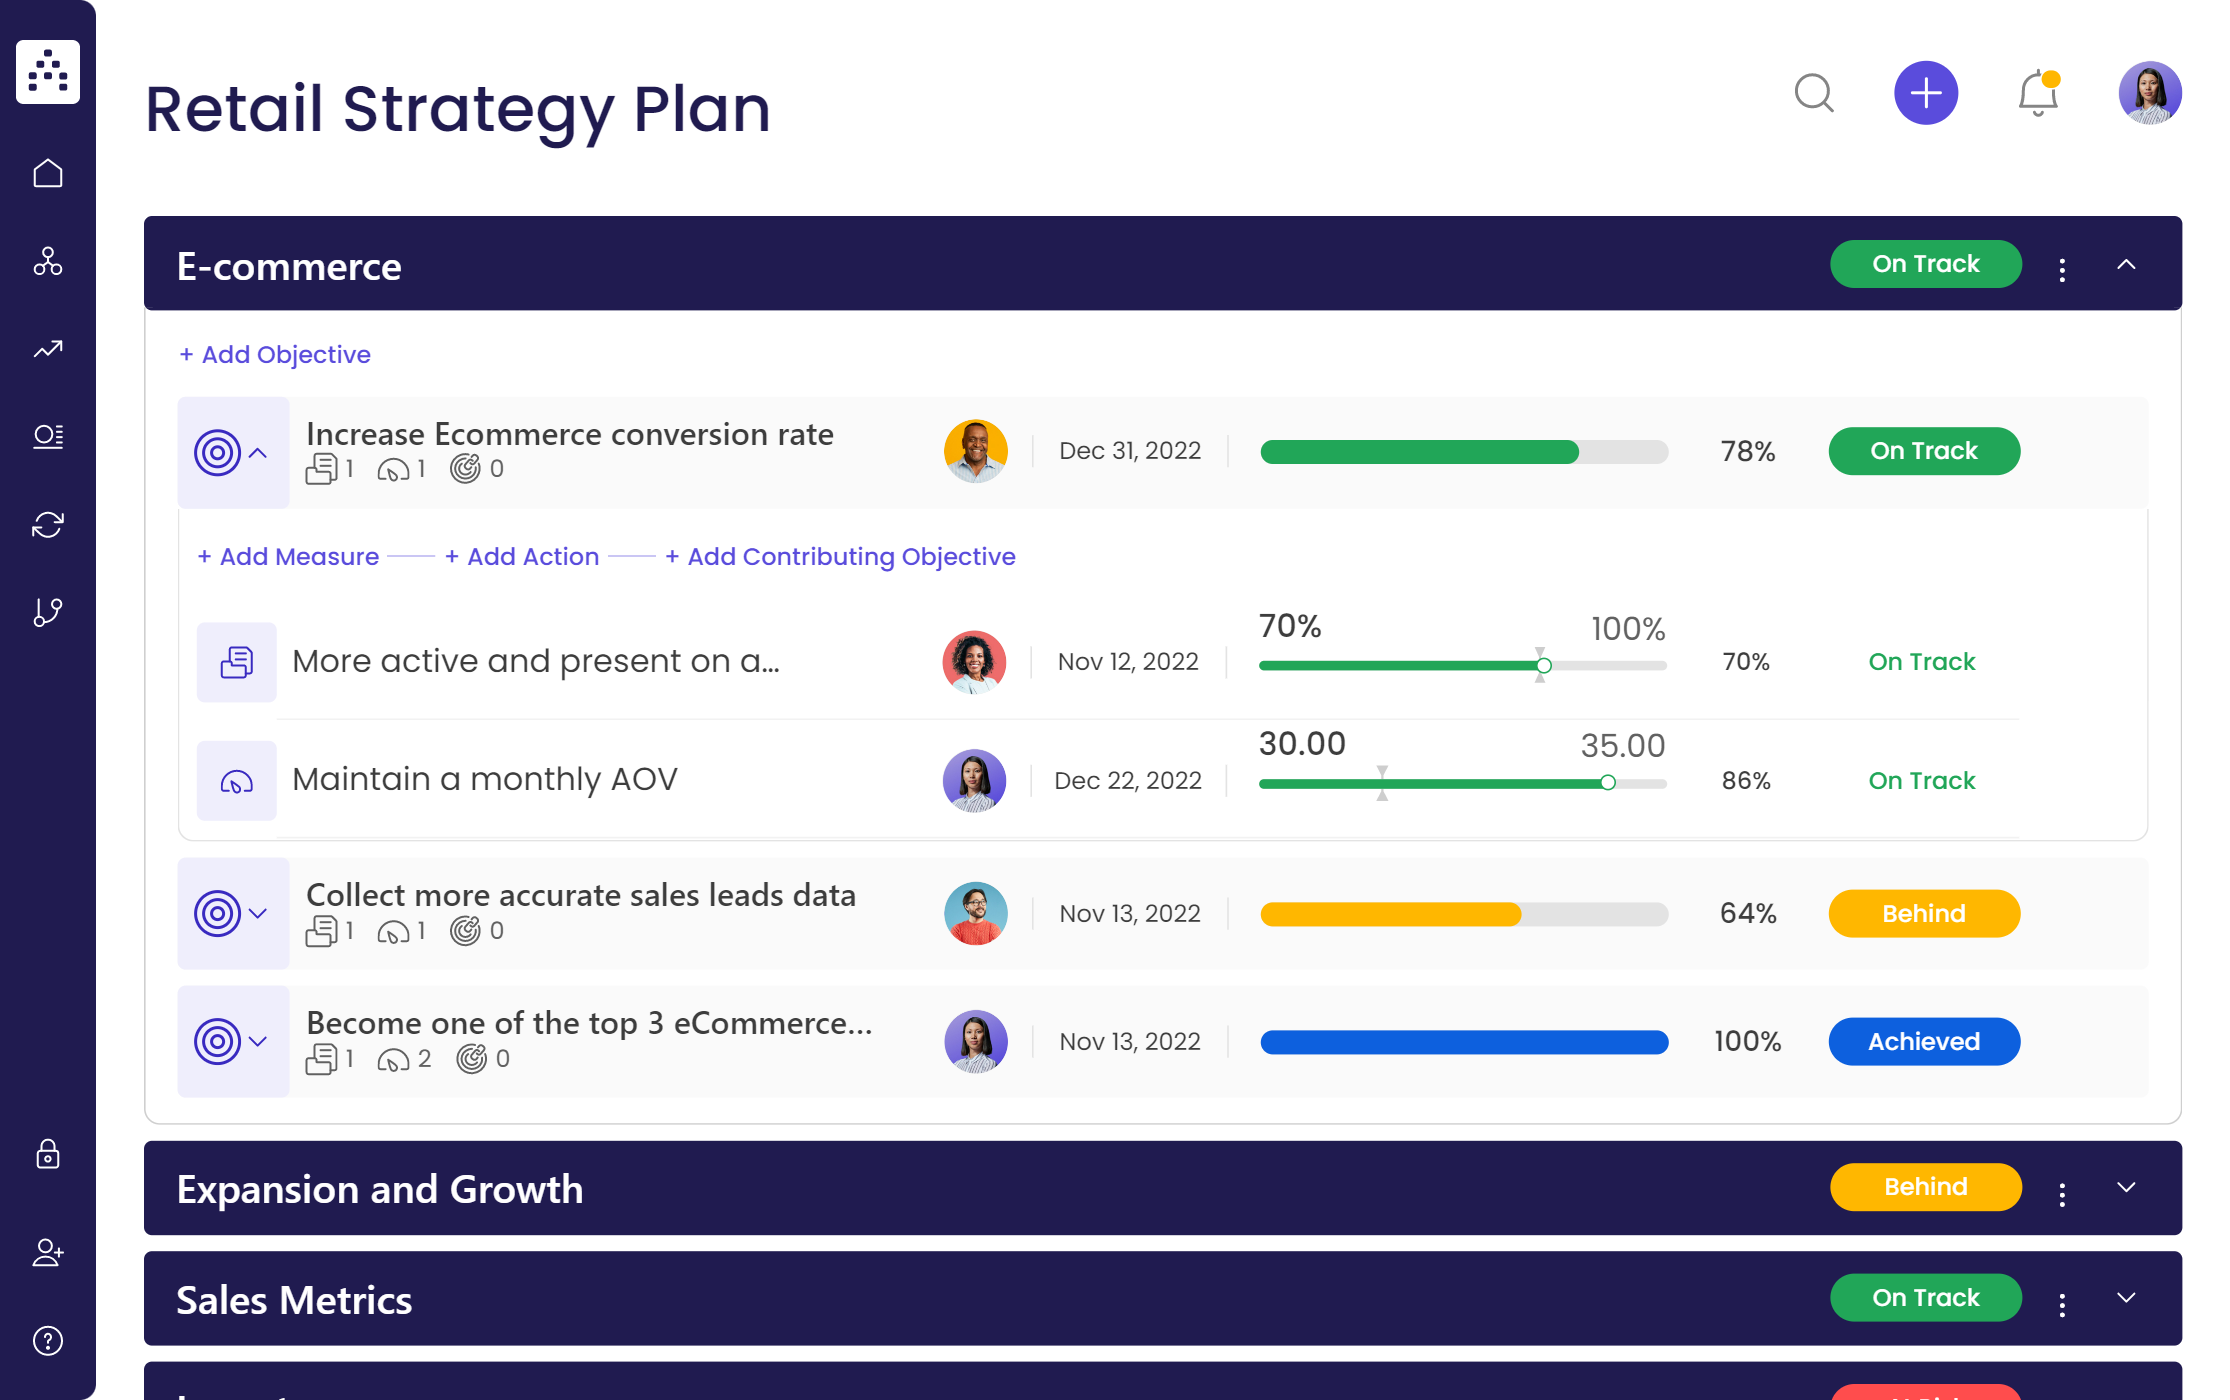
1. Get your free retail strategy plan template
Sign up for Cascade and download your template specifically designed for retail businesses. The template will help you define your retail goals, objectives, and KPIs to measure success.
Here’s a preview of your template:
2. Customize your data
While the Cascade template comes pre-filled with some retail examples, you have the power to customize your data and metrics to ensure they are relevant to your specific retail business needs.
3. Integrate Cascade with your data sources
With Cascade, you have two options to track your KPIs: manually and automatically.
The latter option is far more efficient, as it simplifies data collection and ensures you're working with accurate and up-to-date data.
By integrating Cascade with your favorite business tools, such as Excel, Google Sheets, or your CRM, you can easily import your KPI data and keep your team in the loop.
No more worrying about manual data entry or inaccuracies—let Cascade take care of the hard work for you.
4. Bring in your team
Send an invite to your team members to collaborate on shared KPIs and ensure everyone is on the same page.
With Cascade, you can assign roles and responsibilities, set up notifications, and communicate with your retail teams in one place.
5. Start tracking performance with the retail KPI dashboards
Cascade's powerful dashboards provide real-time visibility into your KPIs and allow you to quickly identify areas that need attention.
With customizable widgets and drag-and-drop features, you can easily visualize and analyze key metrics to improve financial performance and operational efficiency.

👉More related templates with retail KPI examples:
- Retail Visual Merchandising Strategy Template
- Retail Sales Strategy Template
- E-commerce Strategy Plan Template
- Retail Marketing Strategy Template
📚 Recommended read: How To Track KPIs To Hit Your Business Goals
Real-time Visibility: The Key to Success for Retail Businesses 🚀
Effective tracking of KPIs is critical for the success of any retail business. Real-time visibility into business performance enables retail managers to prioritize investments, adapt to market changes quickly, and deliver tangible business value.
Using a strategy execution platform like Cascade is a bold move that will set your business apart. With Cascade, retail executives and managers can easily track their KPIs, collaborate with their teams, and analyze performance metrics to improve operational efficiency.
By making data-driven decisions, retail businesses can confidently take bold steps forward to achieve success in today's highly competitive retail landscape.
Ready to kick it off? Start today with a free forever plan or book a 1:1 product tour with Cascade’s in-house strategy expert.