/Assets%20and%20Heros/Thumbnail-Navi-Foresight.svg)
/Assets%20and%20Heros/Tumbnail-Navi-Ideation.svg)
/Assets%20and%20Heros/Thumbnail-Navi-Portfolio.svg)


To stay ahead in innovation, think of yourself as a detective, keeping a close eye on disruptive trends and new technologies. You want to make informed decisions about what technologies pose a risk to your business, and which present opportunities. Companies need a system to monitor and analyze such drivers of change constantly. This blog provides guidance on how to effectively monitor technologies relevant to your business.
Environmental scanning is necessary for any innovative organization to keep up with the market and plan for the future. Although this can be challenging, it doesn't have to be a chore. Software makes it easier to regularly monitor trends, technologies, startups, and competitor developments. You can then use this information to assess whether your company's strategy is in line with the market scenario and balance your technology portfolio.
Scan the market to build a sustainable competitive advantage
Companies must innovate to offer unique products that meet customers' needs in ways that competitors do not. This is part of maintaining a competitive advantage. The driver of this innovation could be a technology push: when emerging technologies make new products and services possible.
So, how do you stay on top of emerging tech? Software-supported environmental scanning can help you track the latest technology trends. You define the technology fields you are interested in, then scan for noteworthy developments, such as news articles or patents related to these areas of interest. Scanning for startups shows you how entrepreneurs apply new technologies to meet the market's needs while monitoring competitors' activities provides clues into how they're incorporating emerging tech.
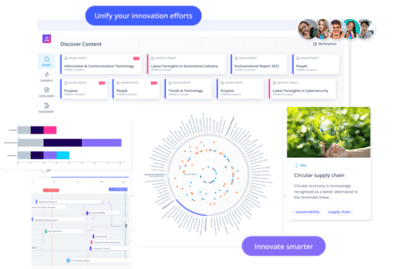
The ITONICS Innovation OS consolidates and manages all this information on one platform to support decision-making in your organization. Visualization tools, such as the Radar, Matrix, Network Graph, and Roadmap, help interpret and compare the information. With ITONICS, you can automate the scouting of technologies and related patents, pinpoint disruptive technologies, and report your insights to management to motivate action.
4 ways to monitor new technologies
Monitoring drivers of change, such as technologies, is one of the most important steps in end-to-end innovation management. If you want to track developments related to a defined technology, open the Signals Feed on the element where you can see a timeline graph of news interest in the topic. You can also search for signals related to a technology in the ITONICS Insights tool using relevant keywords and advanced filters. There's a range of useful tools in the ITONICS Innovation OS to make further connections, described below.
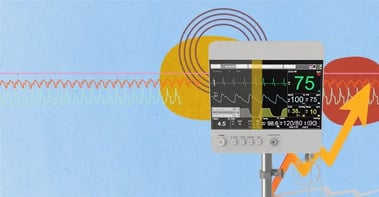
1. Benefit from ITONICS Automated Monitoring
ITONICS reduces the effort of monitoring with the help of AI. It's no longer necessary to search through websites, patent databases, and press releases. With our Strong Signals, the software sifts through millions of data sources, including news, patents, and scientific publications, to alert you when there's a noteworthy change. Notification emails are triggered when there's a significant spike in coverage of a technology you're interested in. It will show you a timeline graph with a summary of the key event. Each technology element in the system has such a graph showing interest over time as well as an automatically generated Signals Feed.
Alternatively, if you want to really narrow down your area of interest and exclude certain topics, ITONICS Insights has more advanced search functionality. You can use the filter to refine the search and, for instance, exclude certain geographies, news sources, or companies from the results. You can then save your query to share and revisit with your team on a regular basis. For even more complex searches, there is the option to do Boolean queries by switching to Power Search.
2. Use visualization tools to analyze tech developments
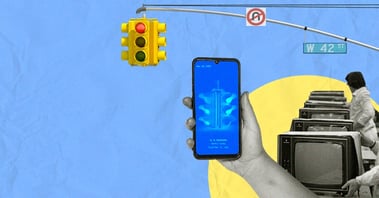
Tools such as the timeline and world map visualization are useful to graphically interpret search results in ITONICS Insights. The timeline visualization shows a representation of the peaks or dips in news, patents, and other publications for the technology you're interested in. This gives you an indication that interest in the technology is on the rise or declining.
The world map visualization uses the country of publication to show the signal results of your search. It allows you to easily see where in the world the technology topic is being talked about and researched. This could inform company decisions on where to expand the business or invest in R&D.
%20World%20Map%205G%20Mobile%20Network%20.webp?width=842&height=801&name=1)%20World%20Map%205G%20Mobile%20Network%20.webp)
The above timeline graph for 5G Mobile Network shows that news reporting about the technology has increased significantly since June 2023. Meanwhile, the world map visualization shows more patents were filed in South Korea than in any other European country.
3. Tag and relate technology elements
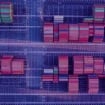
You can tag elements in the ITONICS system to show what they have in common with other elements, such as trends, inspirations, startups, and competitors. Use the tag filter to find elements with similar tags and uncover relevant clusters of content. Elements with common tags can be viewed together using the Tag Cloud visualization.
%20Tag%20filter%20automotive.webp?width=2308&height=1342&name=2)%20Tag%20filter%20automotive.webp)
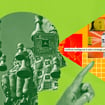
The elements on the Radar can also be related to each other by using relationships— such as "Relates to," "Consists of," "Implemented by," "Drives," "Is driven by," "Disables," etc.—to indicate how technology elements influence others. In this way, you can map out how these drivers of change affect and enable each other. A breakthrough in next-generation battery technology might, for example, accelerate the adoption of electromobility.
%20Drives%20electromobility.webp?width=654&height=497&name=3)%20Drives%20electromobility.webp)
4. Use the Network Graph to analyze relations between technologies
The network graph is a useful visualization to explore connections between elements. If you, for example, want to see which trends and technologies are related, hover over an element to see the links.
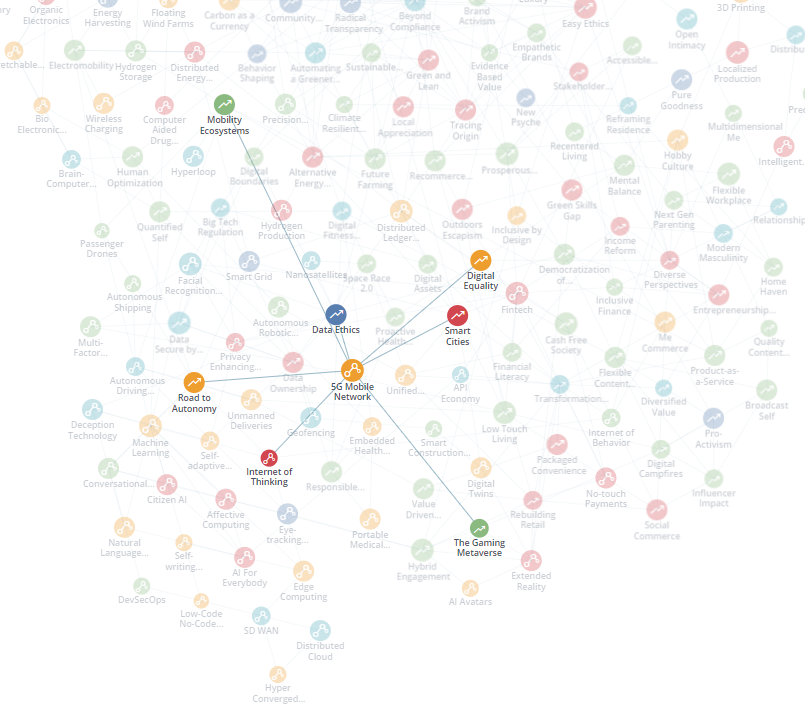
In the network graph above, trends such as Smart Cities, Data Ethics, and Digital Equality are related to the technology 5G Mobile Network. Innovation managers can use the graph to analyze the potential impact of the 5G Mobile Network on other drivers of change and vice versa. An innovation manager may consider how 5G will enhance Augmented Reality (AR) and Virtual Reality (VR) in gaming. Companies in this industry might see the opportunities created by lower latency and increased accessibility for new business models in terms of monetization and in-game advertising.
An innovation platform to monitor drivers of change
The ITONICS Innovation OS provides a single source of truth for your team to monitor and analyze emerging technologies. We made it easy to identify early indicators of market change, link insights to your innovation projects on the ITONICS Roadmap, and swiftly execute your innovation strategy to maintain a competitive advantage. If you want to see how ITONICS can enhance your environmental scanning process, book a free demo with one of our innovation experts.
See the ITONICS Innovation OS in action

Have more time?
- Read Why And How To Use A Trend Radar
- Read Monitoring Trends & Developments: How to Accelerate Weak Signal Detection
- Download our How-To Guide: Environmental Scanning with ITONICS Insights