/Assets%20and%20Heros/Thumbnail-Navi-Foresight.svg)
/Assets%20and%20Heros/Tumbnail-Navi-Ideation.svg)
/Assets%20and%20Heros/Thumbnail-Navi-Portfolio.svg)


As an organization operating in a competitive market, it's crucial to continually analyze the factors that drive change within your industry. These drivers of change, such as trends, emerging technologies, startups, competitors, risks, and ideas, can potentially disrupt the market. However, identifying the most relevant drivers of change can be challenging for many organizations. This blog aims to guide you in identifying relationships between the drivers of change in your industry using tools like ITONICS Radar and the Network Graph.
The importance of identifying relationships between trends, technologies, startups, etc.
Finding the relationships between trends, technologies, startups, etc. is important because it can help organizations better understand how different drivers of change interact with one another and how they might combine to create new opportunities or challenges. By identifying these relationships, organizations can develop more comprehensive and nuanced views of the future and make informed decisions about preparing for it. In the following, we explore the key factors in more detail.
Understanding interactions
Interactions give you an idea of how certain drivers of change affect one another. In simple terms, they are relationships. By understanding the relationships between drivers of change, you understand how different drivers interact with each other and influence each other by maximizing or minimizing each other’s effects. Analyzing interactions helps you identify the butterfly effect's source and connect the dots to make plans to tackle innovation challenges.
Predictive capabilities
Knowing the relationships between drivers of change can provide a deeper understanding of the forces that drive innovation, which can help your organization to make better predictions about future developments and how these changes might impact your business. Consecutively, organizations can more effectively plan for the future and take advantage of emerging opportunities by identifying relationships between drivers of change.
Let's consider the drivers of change: trends and technologies. Any changes in trends will drive technological innovation and vice versa. For instance, Smart Cities are among the most prominent global trends dependent upon 5G Mobile Networks. Smart cities rely on a vast network of interconnected devices and sensors to collect and share data about city life, such as traffic patterns, air quality, and energy usage. To enable this kind of data collection and sharing, cities require fast, reliable, and high-capacity 5G networks to support these devices' massive amounts of data. As an innovation manager, you can drive your predictive capabilities by linking the growth of the trend and technology to forecast the developments in your industry.
Effective decision-making
Understanding the relationships between drivers of change will help your organization to make informed decisions about where to allocate resources and which initiatives to prioritize. This can help organizations to optimize their investments and make the most of the opportunities that arise from innovation. For instance, if you see a relationship between two technologies, but one has a higher Return on Investment (ROI), you can allocate resources to the profitable venture. Similarly, by analyzing relations, you can understand other technologies that can drive the adoption of profitable technology.
Effective ways to identify relations between drivers of change with ITONICS
The ITONICS Innovation Management Software helps organizations find relationships between drivers of change by providing a systematic and data-driven approach to identifying trends, monitoring changes in the business environment, and evaluating the impact of different drivers on organizational performance.
For example, organizations can identify how changes in customer preferences and demographics will likely impact demand for their products or services and how technological advances may disrupt existing business models. By analyzing these different drivers and their interrelationships, our Innovation Operating System can help organizations develop more comprehensive and strategic plans for innovation and growth by analyzing these different drivers and their interrelationships.
ITONICS Radar to explore connections in Relation Mode
The ITONICS Radar Tool can be your organization’s most revered tool for informed technology management and strategic decision-making on which drivers of change to prioritize. The ITONICS Radar allows you to visualize links between the drivers of changes you are focused on, helping you understand their interrelationship.
You can add content to your radar in three different ways:
- Directly import interesting trends or technologies from the ITONICS Showroom to our own Workspace. The ITONICS Showroom contains content curated by our analyst team for you to use and get inspired by.
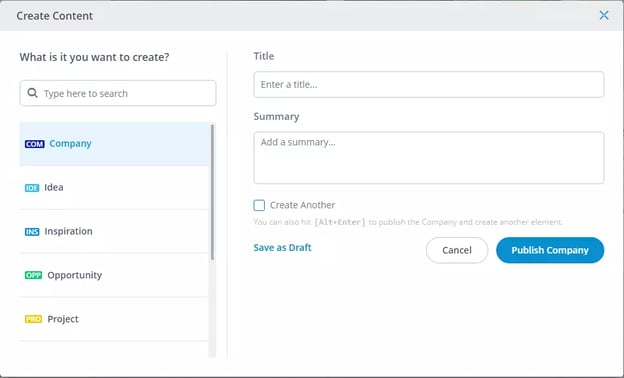
- Create your own content by navigating to your workspace and clicking the 'Create' button. For instance, to create a Trend, select the "Trend" type from the pop-up window, fill out the minimum required fields, and click "Publish Trend."
- You can also search in ITONICS Insights, find an interesting signal, then click 'Create Element from Signal' to turn it into an element that can appear on your radar.
Creating relations in the ITONICS Radar
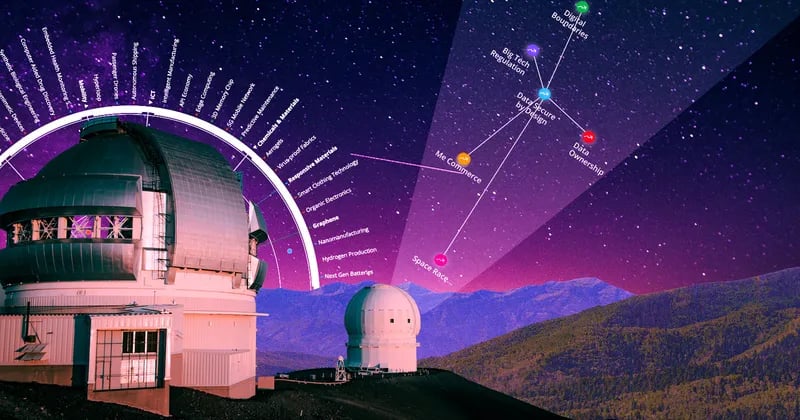
You can use the Relation Mode to see connections between the drivers of change you now have in the system. In the ITONICS Radar, you can access relations mode from the toolbar. Once you have selected the Relation Mode, your content will be displayed along the outer border of the Radar, and lines will connect different content to define their relationships. The direction and type of relation will be indicated on the line.
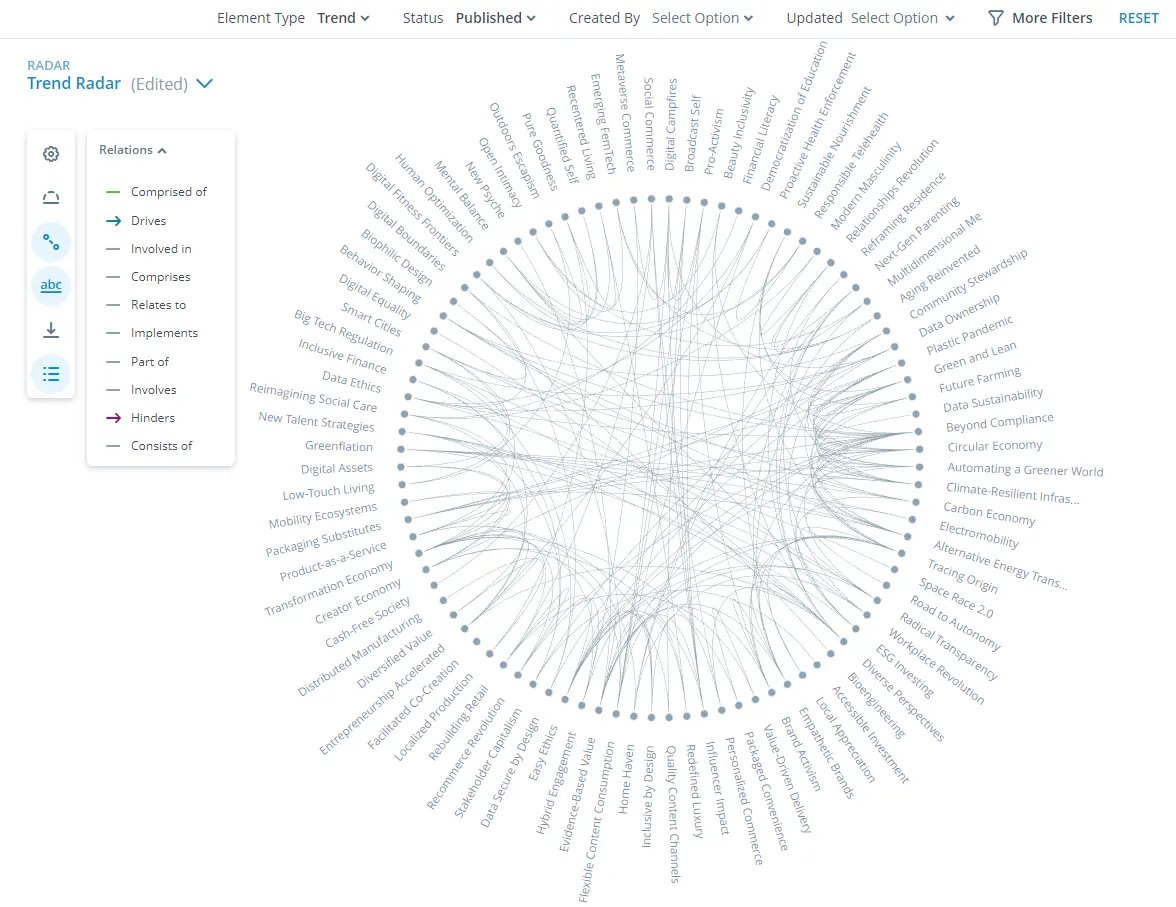
To highlight the relations of a particular driver of change in the system, simply click on the name on the Radar. This shows the relations with lines that connect to the related content.
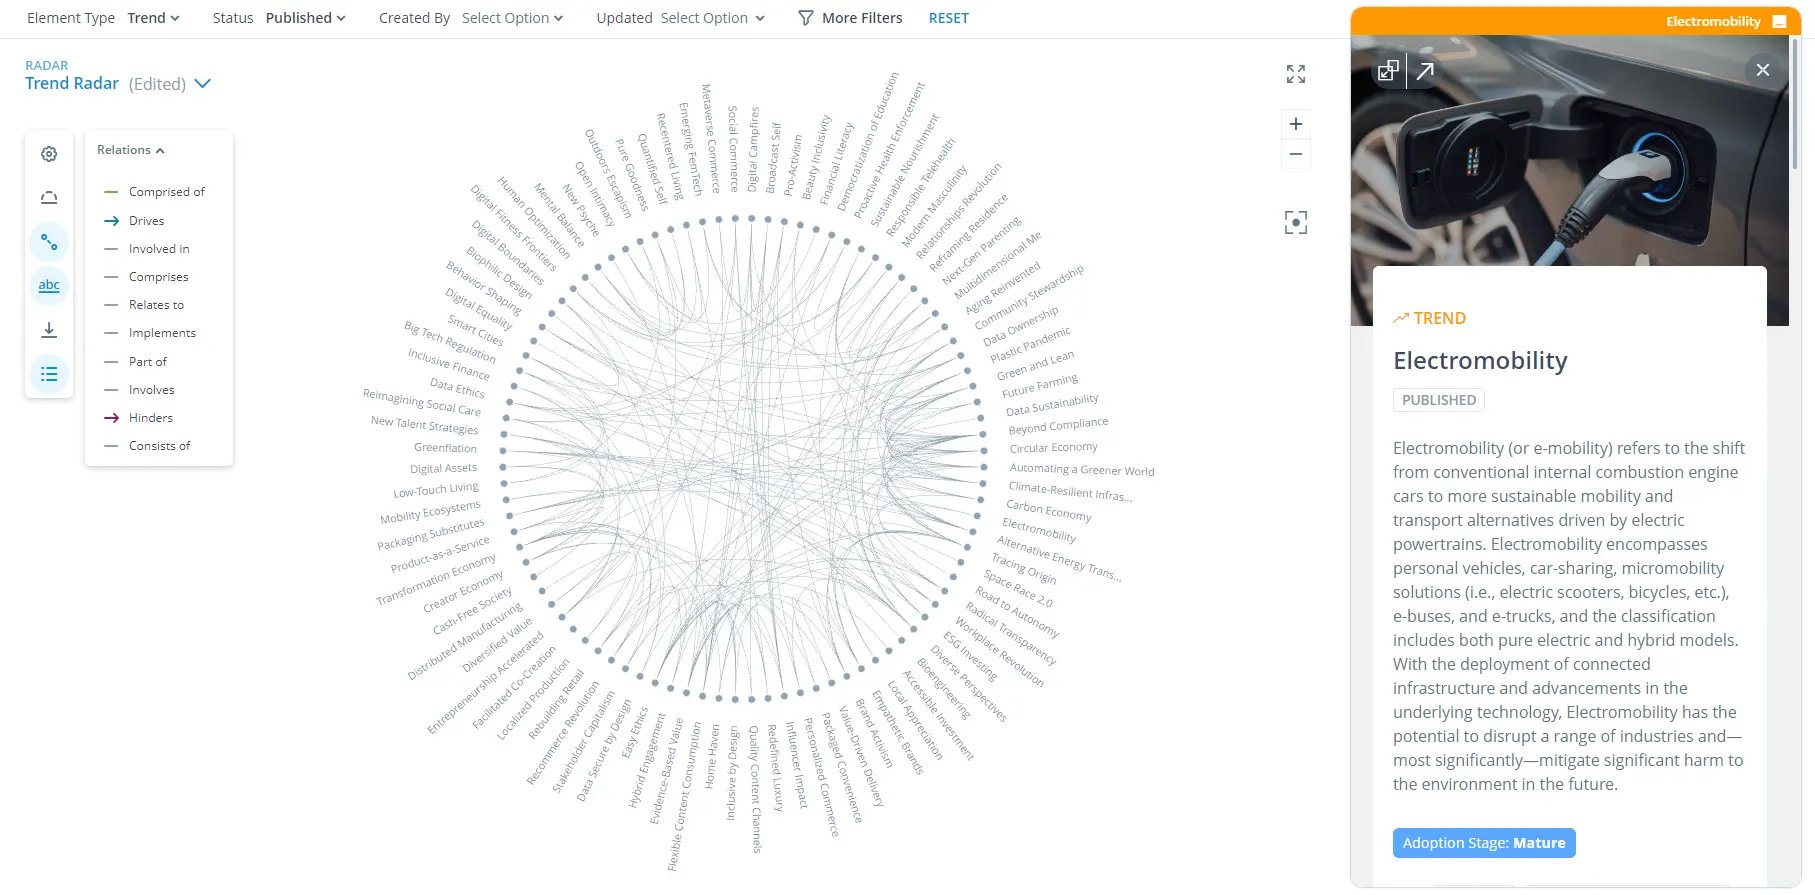
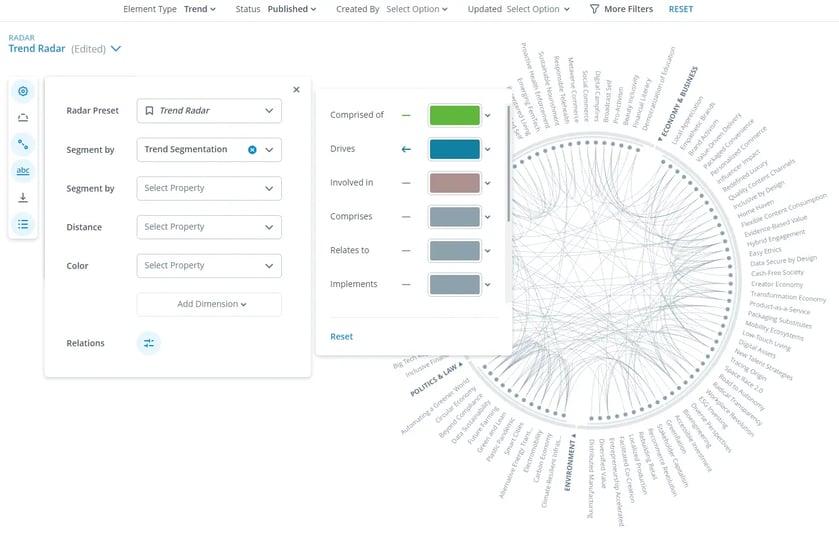
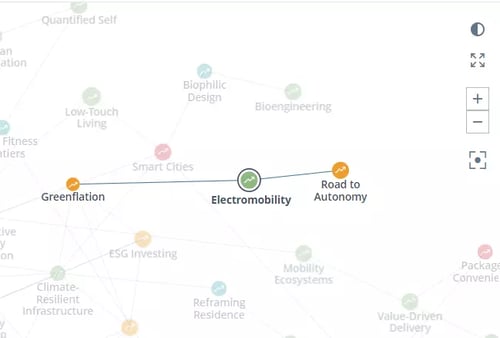
With the ITONICS Radar, you can define the type of relations, such as Drivers, Hinders, and Relates, from the configuration menu, as shown in the image below. For instance, the trend of Electromobility relates to the trend Road to Autonomy; however, the trend of Greenflation has the potential to hinder the development of Electromobility. You can also adjust the colors of different relation types using the legend. To access the legend, click on the toolbar in explorer. The bottom section of the legend will display the Relation type with several dots in combination with a line or arrow graphic that can be changed in color. To set or change colors for a particular relation type, click on the dot and use the color picker to assign a new color.
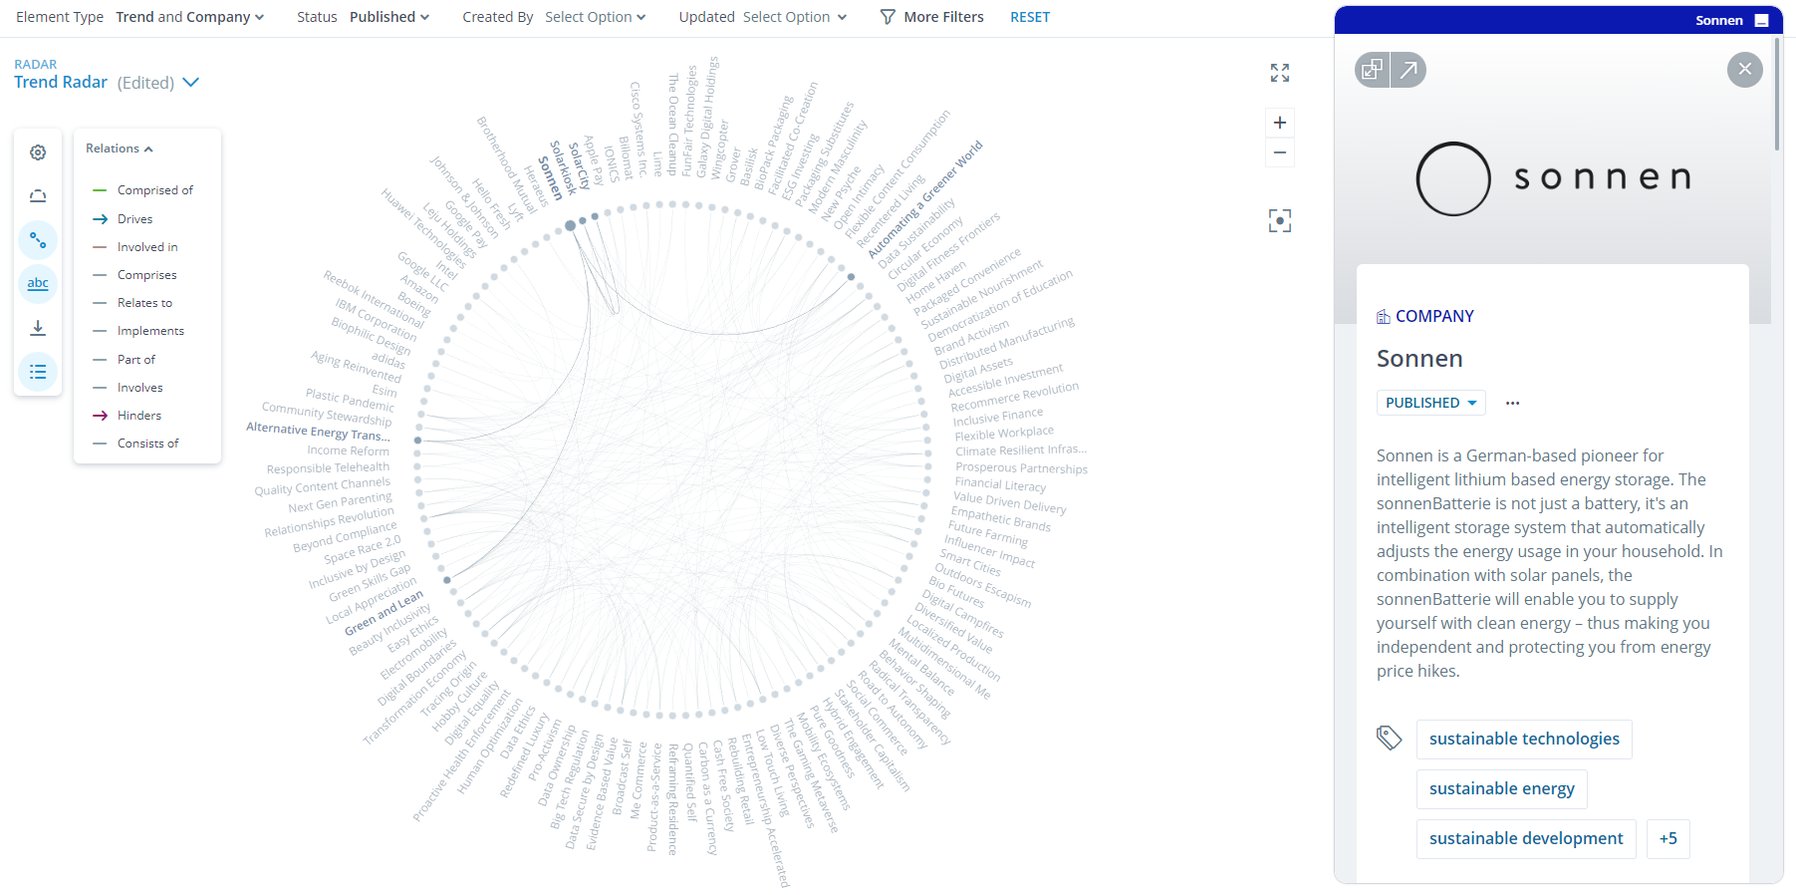
 Below, as an example, the radar shows the relations of company Sonnen (a company that produces intelligent lithium-based energy storage) with other similar companies and related trends. The company can be linked to SolarCity and Solarkiosk. It can also be linked to trends like Climate Resilient Infrastructure, Alternative Energy Transition, Automating a Greener World, Circular Economy, and Green and Lean trends. As an innovation and foresight expert at Sonnen, you can closely monitor the trends for innovation projects and different companies to collaborate or compete with.
ITONICS Network Graph to connect the dots
The Network Graph allows you to view the connections between different drivers of change like trends, technologies, startups, competitors, risks, and ideas. It displays the drivers of change as a network of connected dots. The relations between different drivers of change come preloaded with the ITONICS Network Graph.
You can also click the Configuration button and select Shared Tags as the basis for relations. The Shared Tags configuration helps you to view related drivers of change that tags of similar topics have related. This will rearrange your content based on the number of tags they share. When you hover over a specific, for example, trend, technology, or company name, the visualization will temporarily highlight the other elements with which it shares tags.
Creating relations in the ITONICS Network Graph
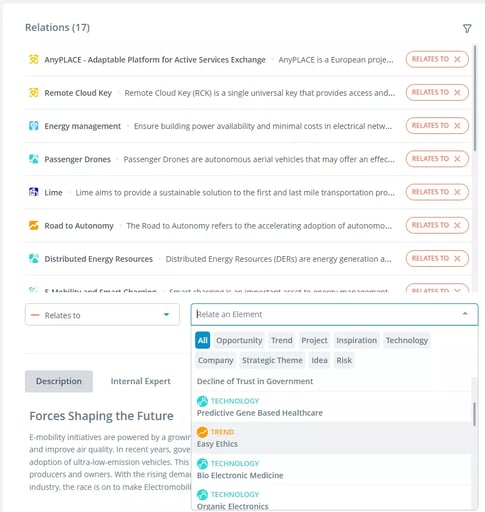
If you want to create relations between drivers of change in the system, you can use the Related Elements functionality. You can choose a relation type through a dropdown selection and select the driver of change you want to create a relation from the "Relate an Element" dropdown.
After creating relations, they will be displayed in a list form in the relation widget of both the source and target content. By establishing logical connections between your content in this way, you can easily visualize the relationships between them.
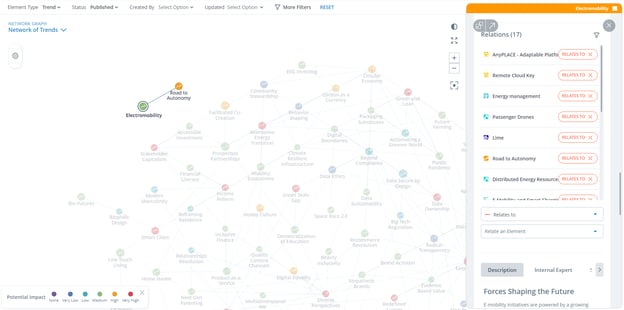
You can connect different drivers of change in your system after you add them to your workspace. If you want to see which drivers of change are related to each other, you can hover over the name. For example, the image below shows that the Electromobility trend is related to the technologies: Distributed Energy Resources, Next-Gen PV, Next-Gen Batteries, Green Hydrogen, Wireless Charging, and Passenger Drones, while Electromobility is related to the trends: Road to Autonomy and Greenflation.
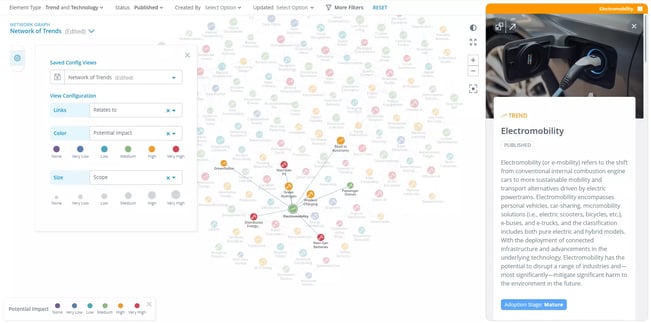 You can filter the result according to the color and size of the dots. In this example, Electromobility in the image above is colored Green which indicates the trend has a medium potential impact on the organization. In contrast, the size of the dots indicates Electromobility as having a high scope.
By relating the relevant drivers of change, you can watch for any changes that may impact the trend, technology, company, or opportunity you monitor or explore. For instance, you are interested in the Electromobility trend and want to understand how related trends like Greenflation impact this technology. Similarly, you can relate different companies with trends and technologies to identify future partners and evaluate startups. You can identify potential investment opportunities or areas to watch closely with the help of related drivers of change.
|
👀 Lookout: When creating new content in the system or reassessing your existing innovation portfolio, use Recommended Relations to quickly identify and relate similar content. Recommended relations are based on a recommender engine, which utilizes machine learning techniques to automatically create content recommendations based on all content within the same workspace.
In a nutshell
Identifying the most relevant trends, technologies, startups, competitors, risks, and ideas can be challenging. One way to approach this challenge is to create relations between drivers of change.
In general, identifying and understanding relationships between drivers of change can help organizations to:
- anticipate new opportunities and threats,
- develop more comprehensive and nuanced views of the future,
- make more informed decisions about how to allocate resources and invest in new technologies and capabilities,
- build more resilient strategies that can adapt to changes in the future.
Software solutions like the ITONICS Innovation OS automate the identification of relations between drivers of change, enabling you to speed up the process and use the resource more efficiently. Ultimately, it helps you to discover innovation opportunities faster. Moreover, tools like the ITONICS Radar or Network Graph help you to improve transparency across teams by sharing views and insights with other stakeholders. Collaborative ratings of trends, emerging technologies, startups, etc., allow for diverse perspectives and centralization of collective intelligence.
Get started with the ITONICS Innovation OS

Have more time?
-
- Read How to Monitor Drivers of Change to Maintain Competitive Advantage
- Download our How-To Guide: Environmental Scanning with ITONICS Insights