/Assets%20and%20Heros/Thumbnail-Navi-Foresight.svg)
/Assets%20and%20Heros/Tumbnail-Navi-Ideation.svg)
/Assets%20and%20Heros/Thumbnail-Navi-Portfolio.svg)


The pace of technological change makes it difficult for companies to keep up. The abundance of information out there requires a method to organize, evaluate and visualize emerging technologies. Innovation management software can replace time-consuming processes and enable a business to identify technology-related threats and opportunities earlier than the competition.
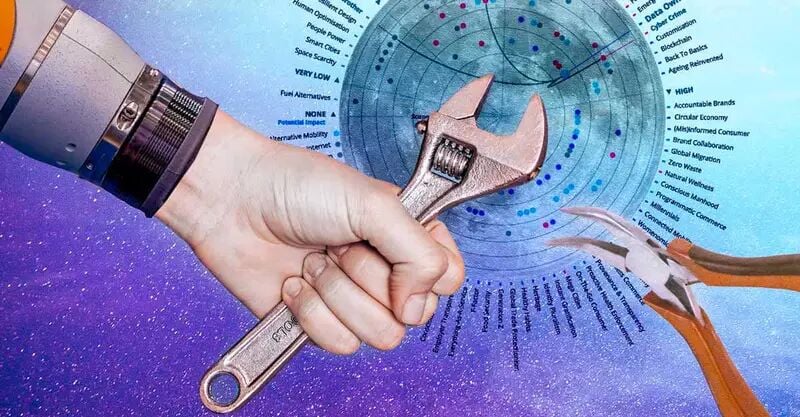
ITONICS provides a Radar tool built to organize complex information so teams can rate new technologies and make informed decisions. Our Radar is flexible and easy to customize. This adaptability means you can configure the radar to suit your organization’s needs and show the information that matters. Let me take you through it.
Also see: How to Create Your Trend or Technology Radar in 5 Minutes
Play around with the embedded Technology Radar above. You can zoom in and out, drag it to look at specific areas, or click on a dot to open its card.
Set dimensions of visual representation on the Radar
Each dot represents a technology and these move to a location on the Radar based on what the primary dimensions, distance, and segmentation, are set to. Click the gear icon to see the current configuration of the Radar. Distance determines how far the dot is from the center, while segmentation places it in terms of the 360 degrees of the circle. By default, the Technology Radar is configured with the ITONICS best-practice preset:
- Segment by: Technology Segment
- Distance: Potential Impact
- Color: Technology Readiness
In this case, Technology Segment refers to the industry/sector that the technology fits under, such as Health Tech, Chemicals, ICT, or Mobility. The dot's color is set with a range of red-yellow-green like a traffic light, indicating how advanced the technology is in its readiness. Bright green means a Technology Readiness Level of 9, and thus ready for commercialization.
Dots further from the circle are there because those technologies are expected to have a smaller impact. Looking at the preset Technology Radar, it, therefore, makes sense to pay more attention to green dots near the circle’s center, because those are technologies ready to enter the market and predicted to have a big impact.
But what if you actually wanted to draw attention to other aspects, not Potential Impact and Technology Readiness? You may, for example, aim to highlight to stakeholders which technologies are relevant and usable by your company. Go ahead and change the embedded Radar’s configuration as follows:
- Segment by: Technology Segment
- Distance: Technology Attractiveness
- Color: Internal Know-How
By changing the configuration, the color and location of the dots change. The technologies in warm colors, such as orange and red, close to the Radar center, are the ones rated as attractive to the company and ones that teams feel capable of implementing in terms of internal know-how.
This visualization is, however, only meaningful if your team added their own ratings to the technologies on the Radar, so that it reflects their aggregated opinions. If the majority of dots are all in the same ring of the circle, that might indicate that you have not yet sufficiently differentiated those technologies through collaborative rating. In the embedded Radar intended for demonstration purposes, the values for attractiveness and internal know-how were set by ITONICS. When you sign up for our software, you and your team will enhance the Radar and make it meaningful by adding ratings that reflect your organization’s perspective.
So far, we’ve only used three dimensions of visual representation on the Radar: Segment, Distance, and Color. There are two more you can use: Halo (a translucent circle that expands from the dot ) and Donut (a loop around the dot that fills up clockwise). Conceptually, it makes sense to use these visual indicators to suit the property it is set to communicate. For instance, the Halo is suitable for properties related to size, such as Potential Impact and Scope. The Donut suits properties that indicate a degree of completion, such as Internal Know-How or Technology Readiness.
Here’s a tip: don’t add additional properties and dimensions unless it’s key to what you want to communicate with the radar. You want your colleagues to notice and concentrate on the most important info, not distract them with nice-to-know info. So it may be better in some cases to use only one secondary dimension (Color, Halo, or Donut) at a time.
Visualize industry-related technologies
Another way of decluttering a Radar view and focusing on what’s important is to click on the industry segment name, such as “HEALTH TECH & LIFE SCIENCES” in bold text at the rim of the radar. This action will expand that segment and exclude technologies in other industries that aren’t relevant to the conversation.
How to leverage your technology radar in your organization
The aim is to configure the view to make intuitive sense to a viewer so that your Technology Radar can be a “go-to space” for your colleagues, a single point of truth for technology management and further stakeholders. This is what global market leader Cisco did, adapting the ITONICS Radar to identify and track novel technologies emerging outside of Cisco.
A different use case of the Tech Radar is to categorize and rate technologies already in use by your organization. The goal could be to collectively decide which technologies need to be abandoned and which are worth investing in further.
By interacting with the embedded Technology Radar above, you’ve experienced another benefit of our visualization tool: get people to engage with your insights by embedding the Radar on an intranet or public webpage. We’ve made it easy to integrate and communicate radars throughout your organization with our Embed Feature.
Get a demo to learn more about the features and functionalities of our software.
See the ITONICS Innovation OS in action

Have more time?
- Read How to Identify Relevant Trends and Technologies for Your Organization
- Read Why And How To Use A Trend Radar
- Download Success Story: Cisco Technology Radar