/Assets%20and%20Heros/Thumbnail-Navi-Foresight.svg)
/Assets%20and%20Heros/Tumbnail-Navi-Ideation.svg)
/Assets%20and%20Heros/Thumbnail-Navi-Portfolio.svg)


The imperative for innovation is clear: As the technological landscape rapidly evolves, with AI and other emerging technologies taking center stage, businesses must consistently track and fine-tune their innovation initiatives to maintain a competitive edge. The tug-of-war between immediate financial returns and long-term innovation investments, however, can often lead to the latter being sidelined. This calls for actionable, insightful, and quantifiable innovation KPIs to guide these initiatives toward the achievement of strategic objectives.
In this article, we unpack key performance indicators along the end-to-end innovation process. We'll equip you with the tools needed to nourish and refine your innovation KPIs, ensuring they truly embody the progress made toward your innovation goals.
The need to evaluate innovation performance
KPIs serve as quantifiable measures that reflect an organization's progress towards achieving its strategic objectives. In the context of innovation management, KPIs provide valuable insights into the effectiveness of innovation initiatives, processes, and outcomes. They help organizations gauge their innovation capabilities, identify areas for improvement, and make data-driven decisions.
The importance of assessing innovation performance extends throughout the entire end-to-end innovation management process, making it vital for organizations to take a holistic approach. The entire process, from environmental scanning to ideation to implementation, should be continually scrutinized.
This is because innovation is not an isolated event; it's an ongoing cycle that integrates different phases, each contributing uniquely to the final outcome. Measuring success solely based on end product performance or financial return can lead to oversight of crucial indicators such as process efficiency, culture of innovation, and employee engagement in innovation activities. For instance, an abundance of ideas at the initial stage is worthless if there's a bottleneck in the development phase. Similarly, a fast time-to-market loses its merit if the launched product fails to resonate with customer needs or expectations.
KPIs for innovation management
Environmental scanning KPIs
Market trends awareness
This KPI measures the organization's ability to identify and stay updated on emerging market trends and disruptive forces that could impact its innovation strategy. It includes tracking market research efforts, monitoring competitor activities, and analyzing industry reports.
- Number of market research efforts conducted per quarter
- Percentage of employees involved in monitoring competitor activities
- Number of industry reports analyzed annually
- Number of identified disruptive forces impacting innovation strategy
Technology landscape analysis
This metric assesses the organization's understanding of technological advancements and their potential application to innovation initiatives. It involves monitoring technological trends, evaluating emerging technologies, and conducting technology scouting activities.
- Number of technological trends monitored and tracked monthly/quarterly
- Number of emerging technologies evaluated and assessed annually
- Number of technology scouting activities conducted per quarter
- Number of potential technology applications identified for innovation initiatives
Competitive intelligence index
This index measures the organization's ability to gather and analyze information about competitors, including their innovation strategies, products, and market positioning. It helps identify competitive threats and opportunities, supporting informed decision-making.
- Number of competitor analysis reports generated per quarter
- Percentage of competitor innovation strategies analyzed and documented annually
- Number of products and services analyzed against competitors annually
- Percentage of market positioning comparisons made against competitors quarterly/annually
Ideation KPIs
Idea generation and conversion rates
Tracking the number of ideas generated and their conversion into tangible outcomes provides valuable insights into the effectiveness of the innovation pipeline. High idea generation rates combined with a substantial conversion rate indicate a healthy and robust innovation ecosystem.
- Number of ideas generated per month/quarter/year
- Number of ideas successfully implemented or launched per month/quarter/year
- Time taken from idea submission to implementation/launch
Time-to-market
This metric measures the time it takes for an idea to transform into a market-ready product or service. A shorter time-to-market signifies enhanced agility and competitiveness, enabling organizations to seize opportunities and respond to evolving customer needs more swiftly.
- Average time taken from idea submission to market launch for each product or service
- Median time-to-market across all product or service launches
- Percentage decrease in time-to-market compared to the previous year/quarter
- Number of iterations or product iterations required before market launch
Innovation culture index
This index assesses the organization's culture of innovation, including factors such as openness to new ideas, risk-taking, and tolerance for failure. It helps gauge the effectiveness of creating an environment conducive to generating and nurturing innovative ideas.
- Employee surveys or assessments to measure the perception of openness to new ideas within the organization
- Number of successful idea implementations originating from different departments or teams
- Percentage of employees participating in innovation-related training or workshops
- Percentage of employees contributing to innovation campaigns / challenges
Portfolio management KPIs
Return on innovation investment (ROII)
ROII assesses the financial return generated from innovation initiatives in comparison to the resources invested. It enables organizations to determine the efficiency and profitability of their innovation efforts and make informed decisions about resource allocation.
- Financial return generated from innovation initiatives (e.g., revenue, cost savings, market share growth) compared to the resources invested (e.g., R&D budget, time, human capital)
- Return on Investment (ROI) specifically calculated for innovation projects or initiatives
- Percentage increase in ROI compared to the previous year/quarter
- Payback period for innovation projects (time taken to recoup the initial investment)
Intellectual property (IP) and innovation portfolio
Tracking the growth and quality of an organization's IP and innovation portfolio offers insights into its long-term innovation strategy. Key metrics include the number of patents filed, the success rate of patent applications, and the diversity and depth of the innovation portfolio.
- Patent portfolio growth rate: Percentage increase in the number of patents filed or granted over a specific period (e.g., quarterly, annually)
- Patent application success rate: Percentage of patent applications that are granted or approved compared to the total number of applications filed
- Innovation portfolio diversity index: Measurement of the variety of innovation projects or initiatives within the portfolio, such as different technology areas or market segments represented
- Commercialization rate of innovations: Analysis of the commercialization rate by technology area or market segment to identify areas of success or improvement
Innovation project success rate
This metric evaluates the success rate of innovation projects within the organization's portfolio. It considers factors such as project completion, commercialization, and achieving key milestones. A high success rate indicates effective portfolio management and execution.
- Percentage of completed innovation projects within the organization's portfolio
- Percentage of innovation projects that successfully reached key milestones or achieved predetermined objectives
- Commercialization rate or percentage of innovation projects that were successfully brought to market
- Percentage of innovation projects generating positive financial outcomes (e.g., revenue, cost savings)
Implementing KPIs effectively
To ensure the successful implementation of KPIs in innovation management, organizations should follow these best practices:
a) Alignment with strategic objectives
KPIs should align closely with the organization's overall strategic goals and innovation strategy. By establishing KPIs that directly reflect these objectives, organizations can ensure that their innovation efforts contribute to their long-term success.
b) Regular monitoring and review
KPIs should be monitored and reviewed regularly to track progress, identify trends, and make timely adjustments. Real-time tracking allows organizations to respond swiftly to changing market dynamics and proactively address any bottlenecks or challenges.
c) Clear communication and accountability
Establishing clear communication channels and assigning accountability for KPIs helps create a culture of ownership and responsibility. By involving all stakeholders, organizations foster a collaborative environment focused on achieving innovation goals.
d) Data-driven decision-making
KPIs provide organizations with valuable data and insights. Leveraging this information enables informed decision-making, optimization of innovation processes, and identification of areas that require additional investment or adjustment.
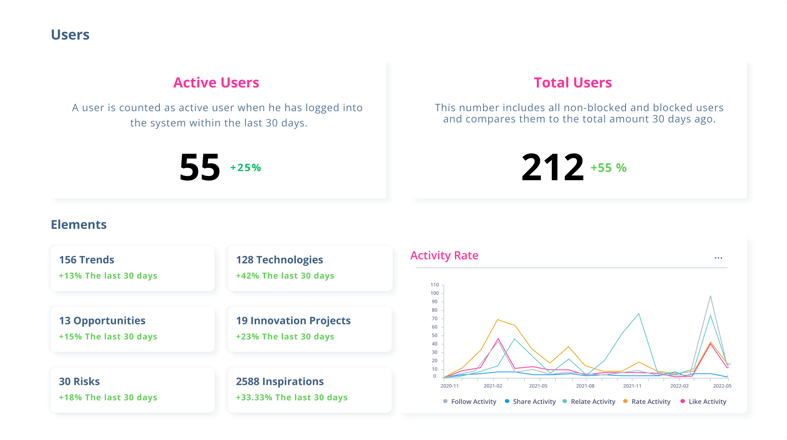
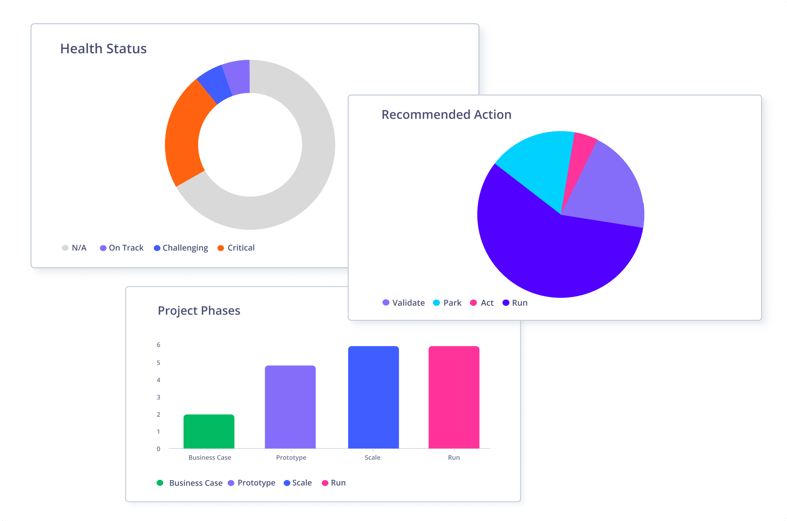
Unlocking innovation success with ITONICS
Innovation management, when coupled with effective tracking and assessment, can become a strategic accelerator for any organization. KPIs serve as invaluable tools to gauge the pulse of innovation activities, ensuring that they are well-aligned with strategic objectives and are efficiently driving the desired business outcomes.
The ITONICS Innovation OS seamlessly integrates foresight, ideation, and portfolio activities. This holistic approach allows teams to consolidate all data in one place, making it much easier to evaluate and act on information.
By presenting key performance indicators and critical insights in a visually appealing and easily understandable manner, ITONICS ensures that organizations can swiftly navigate the vast ocean of innovation data, foster decision-making, and optimize their innovation strategies for long-term success.
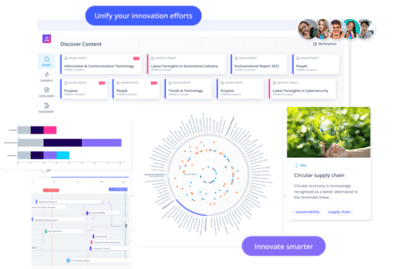
See the ITONICS Innovation OS in action