Amidst an ever-changing and unpredictable market landscape, Fortune 500 companies are increasingly turning to the Scaled Agile Framework® (SAFe®) to enhance their value streams and meet customer demands. However, despite substantial investments, a growing number of organizations are grappling with the disheartening reality of failing to achieve their operational and business objectives.
Organizations confront a harrowing truth in the quest for business agility: they still struggle to measure flow within their value streams. This critical blind spot hampers efficiency and productivity, leaving companies vulnerable to missed opportunities and diminished competitiveness. This unsettling trend highlights the pressing need for urgent measures to overcome these obstacles and drive success.
In this article, we explore the prominent role of flow in the latest updates to SAFe 6.0, and give insight into how enterprises can use Flow Metrics to measure and accelerate flow throughout the software delivery process.
How to Accelerate Flow in SAFe® 6.0
SAFe emphasizes the continuous flow of value to customers, urging organizations to break free from traditional project cycles and waterfall phase gates that hinder progress. In the latest updates from SAFe 6.0, organizations can eliminate impediments to flow by optimizing for eight flow accelerators.
1. Visualize and Limit WIP
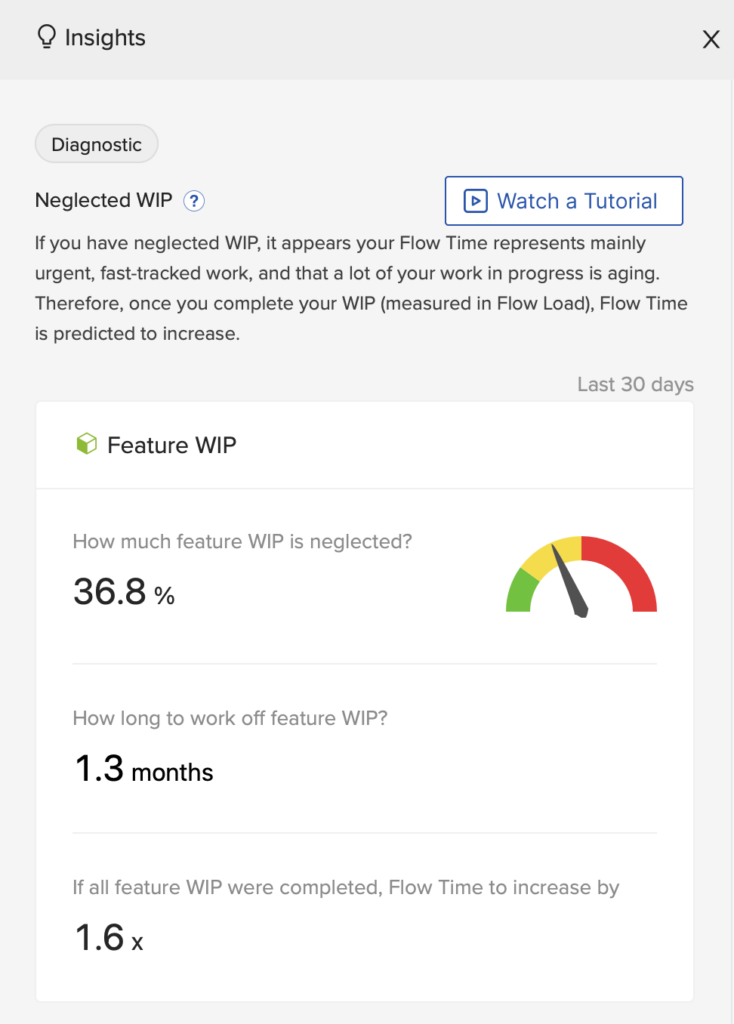
When faced with overwhelming work-in-progress (WIP), a team’s priorities are blurred, and frequent context-switching occurs. This diminishes productivity while prolonging wait times for other priorities. Balancing demand and capacity is crucial, and Flow Load plays a pivotal role in assessing this equilibrium.
Flow Load® is a measurement of WIP, calculated by measuring all Flow Items (features, defects, risk, and debt) within a value stream, be they in active or in a wait state. Visualizing Flow Load can be done using software solutions like Planview Viz®, which helps identify optimal Flow Load (i.e., where high Flow Velocity® and low Flow Time coincide) and neglected WIP.
2. Address Bottlenecks
Bottlenecks disrupt upstream processes and cause delays downstream. There are several types of bottlenecks, including resource scarcity, lack of automation (e.g., CI/CD pipelines, testing), process timing (e.g., funding approvals, end-to-end testing, waiting for change approval), and dependencies.
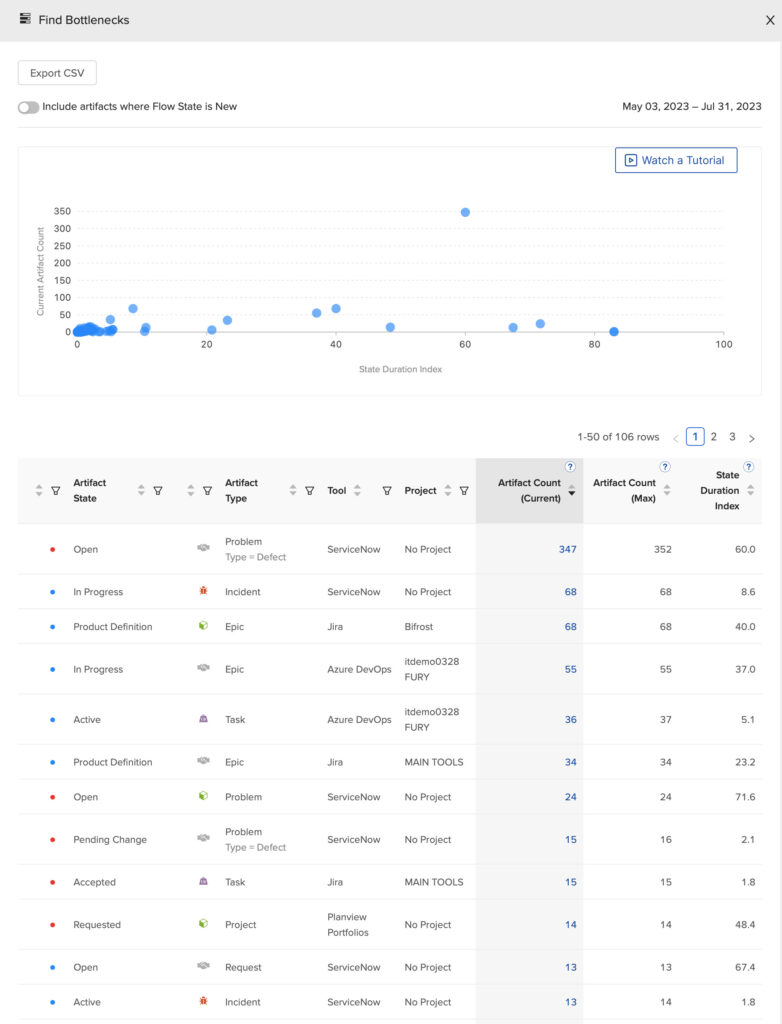
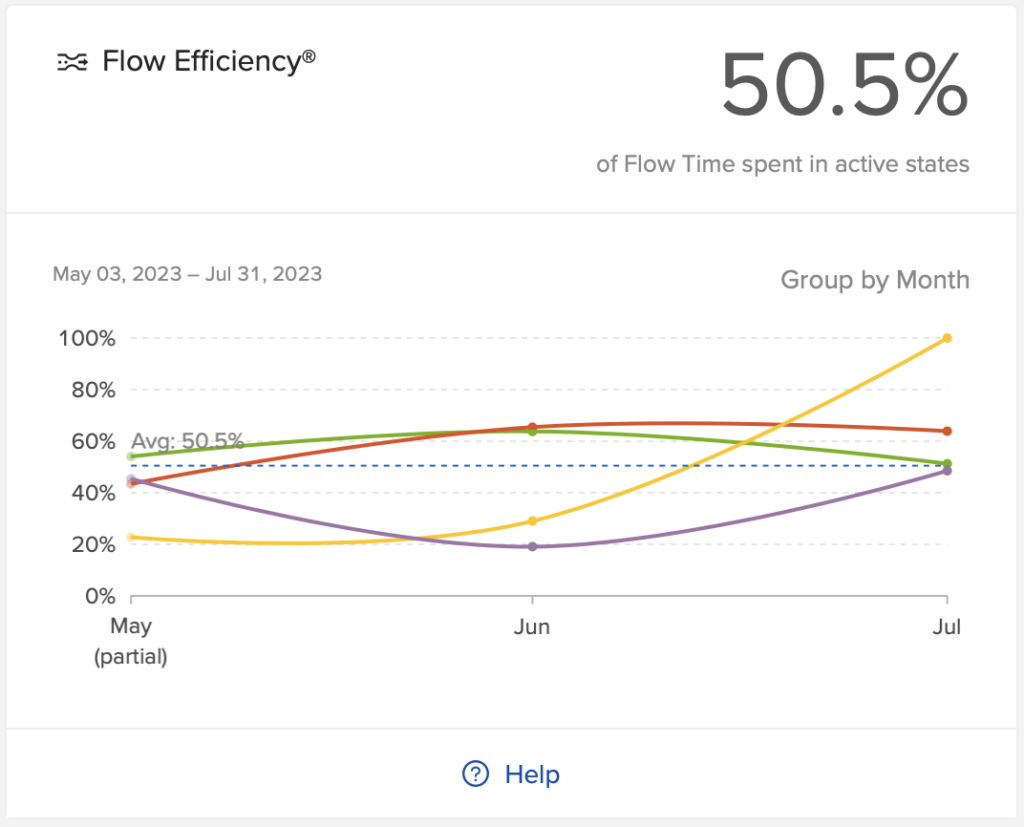
Resolving bottlenecks should be a primary focus, as they can prevent the value stream from reaching its full capacity. This can be addressed utilizing Flow Efficiency®, which measures waste within a value stream. It is calculated by dividing the number of days a Flow Item spends in active state by the number of days it spends in active and waiting states. The lower the Flow Efficiency, the longer work stagnates in a waiting state.
Planview Viz has a Bottleneck Finder feature that quickly pinpoints bottlenecks in your process by analyzing your value stream data and Flow Efficiency. This visualization helps you determine how active work truly is.
3. Minimize Handoffs and Dependencies
Handoffs occur when information, tasks, and feedback are passed between different teams or individuals, creating delays and inefficiencies in the value flow. Dependencies arise when one team relies on another team’s work to progress. These situations lead to wasted time and effort and potential errors due to incomplete knowledge transfer.
To address these issues, forming teams and ARTs with the necessary knowledge, skills, and authority to work collaboratively and ensure a smooth and uninterrupted flow of value throughout the process is crucial.
The Flow Efficiency metric is useful in this scenario, as it helps identify where handoffs are taking longer to complete, allowing teams to address knowledge gaps, assimilate processes, and drive strategic business outcomes.
4. Get Faster Feedback
Early feedback is crucial for driving improvement in product development, but it gets hindered by limited customer access, development delays, and infrequent integration.
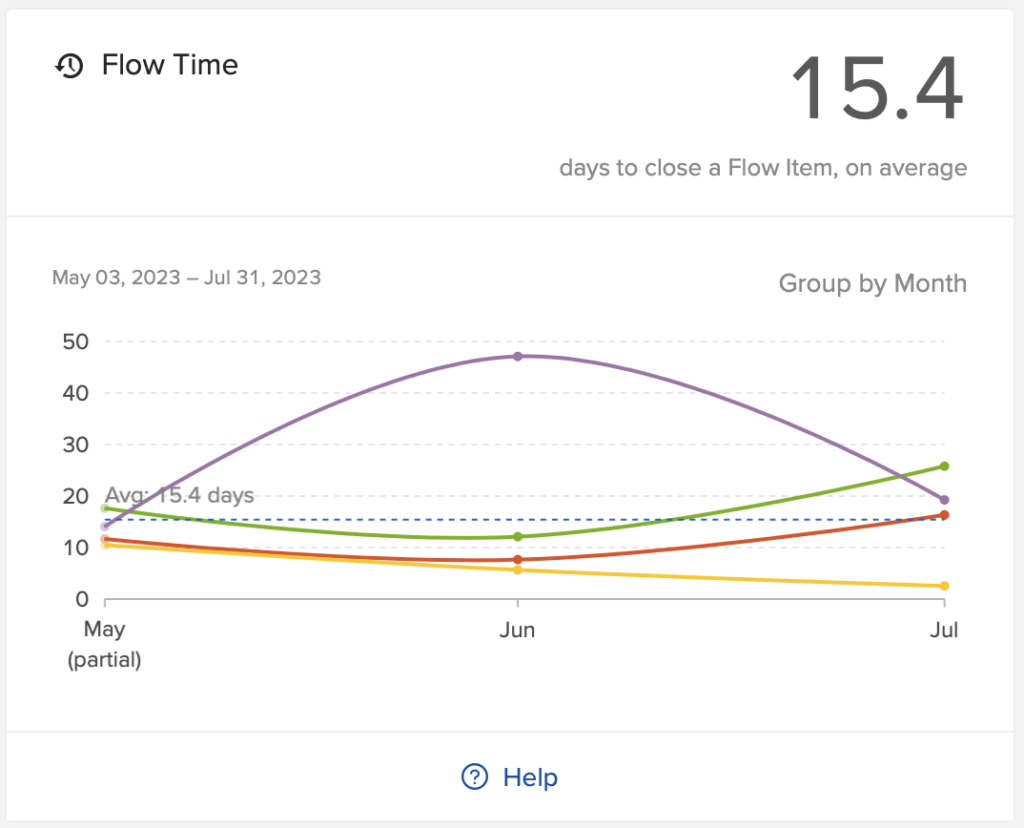
Improving Flow Time enables teams to get faster feedback by reducing the time it takes for work to move through the development value stream. When work flows smoothly and quickly, it reaches the appropriate stakeholders and customers sooner, allowing for timely feedback and iteration. This shorter feedback loop enables teams to make adjustments and improvements earlier in the process, leading to faster learning and more effective outcomes.
5. Work in Smaller Batches
Working in smaller batches means breaking down work into smaller, manageable pieces. This allows teams to receive feedback more quickly and make improvements faster. By reducing the size of work items, teams can avoid overwhelming themselves with too much work at once. This helps them stay focused and deliver higher quality results.
Smaller batches also enable teams to streamline their processes and minimize delays, leading to smoother and more efficient workflows. Automation enabled by integration tools like Planview Hub plays a vital role in this, as it helps streamline repetitive tasks and ensures a consistent and reliable delivery process. By embracing smaller batches and automation, teams can achieve greater efficiency and continuous improvement in their work.
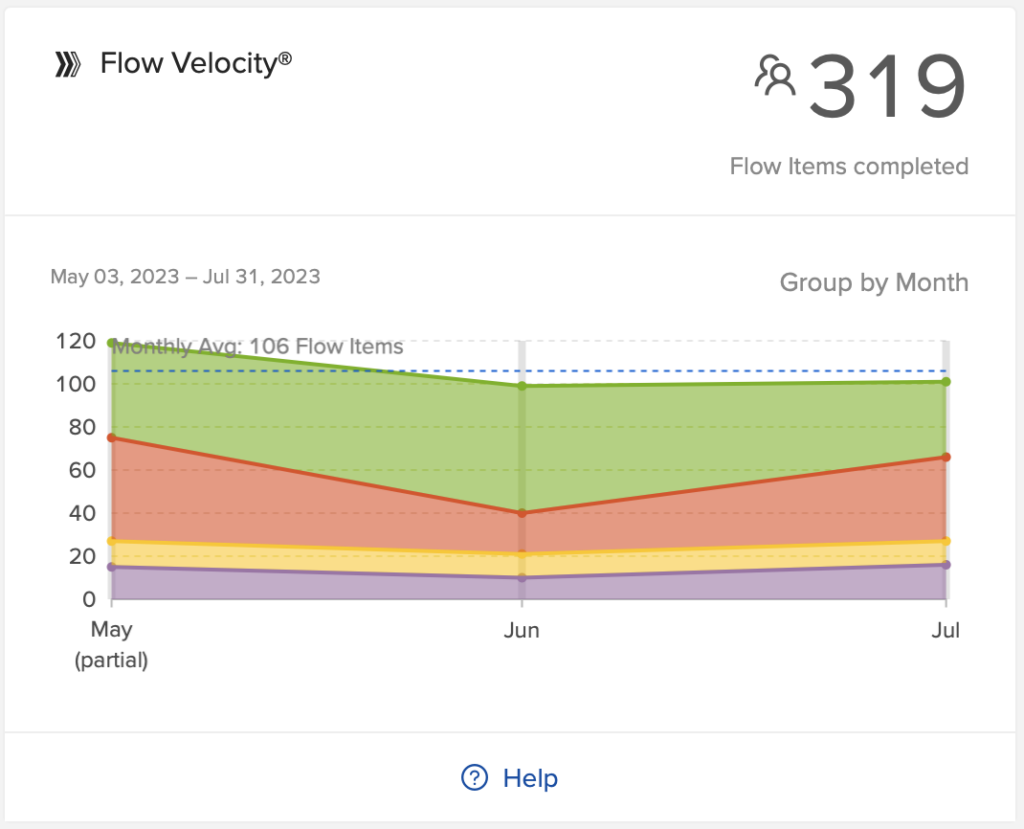
Tracking Flow Velocity helps you measure how much value teams deliver and whether delivery is accelerating, decelerating, or staying constant.
6. Reduce Queue Length
To accelerate flow, shorten the input queue. Long queues lead to waste, delays, and information decay, causing extended waiting times. A large queue of work delays feature delivery, regardless of team efficiency. Reducing queue length minimizes delays, waste, and improves flow and predictability.
Flow Time provides a clear and customer-centric measure of how long it takes for work to move through the value stream, from initiation to delivery. Organizations can evaluate the impact of their investments on time-to-value by analyzing trends in Flow Time over time. This analysis also provides valuable insights into the duration of approved requests, helping organizations make informed decisions about their delivery timelines.
The Flow Modeler feature in Planview Viz is a visual layout of the end-to-end workflow of an entire value stream, from customer request to customer delivery, and reveals the duration of work as it progresses through the value stream. Flow Modeler builds the value stream map directly from the data in your tools and shows in real time where bottlenecks are emerging. It’s one living source of truth of how work flows from idea to outcome, helping to ensure critical work is always on track.
7. Optimize Time ‘In the Zone’
Being in a state of deep engagement, often known as “being in the zone,” fosters creativity and fulfillment. Attaining this requires uninterrupted focus time, autonomy, and connection with others. Traditional work environments with functional silos and excessive WIP impede teams from entering the zone. To remedy this, SAFe 6.0 emphasizes the importance of establishing a continuous flow of value and creating an environment that allows uninterrupted time and space for complex tasks.
Excessive WIP amplifies context switching and wait times. By measuring all the Flow Metrics, teams can effectively reduce context switching, enabling them to operate more efficiently and deliver value more rapidly.
8. Remediate Legacy Policies and Practices
On the journey to Agile transformation, enterprises must identify and address legacy policies and practices obstructing flow. These outdated practices often hinder progress and include examples such as fixed scope, quality management systems based on waterfall methodologies, and unnecessary standards.
By eliminating these obstacles, organizations can cultivate a culture of continuous improvement and unlock the full potential of Agile practices, empowering enterprises to optimize flow and drive innovation.
An Easy Way to Visualize Value Stream Flow
In the Scaled Agile Framework, Flow Metrics play a crucial role in measuring and improving flow. Complementing quantitative metrics with qualitative data ensures alignment with customer needs and timely delivery of solutions. Flow Metrics provide a comprehensive view of value flow through the development value stream, allowing organizations to gain valuable insights and make informed decisions. Automating the collection of these metrics becomes effortless with Planview Viz.
Gain valuable visibility into your delivery processes so you can make better decisions that align with your strategic business outcomes. To learn more, watch a demo of Planview Viz to see how easy it is to visualize your Flow Metrics or read the eBook, How to use Flow Metrics in the SAFe® Cadence.