Remove features dashboards-reports
article thumbnail

Idea Estimation and the Reporting Dashboard

IdeaScale

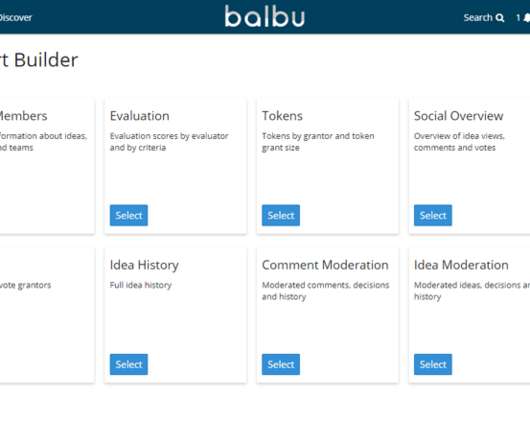
That functionality just got even more powerful with the new reporting dashboard which reports on outcomes. If you’re not already familiar with the feature enhancements offered by the new reporting dashboard, you can read about them here. Want to see how this might work in action?

Report 100
article thumbnail

Tableau To Power BI Migration

Acuvate

While Tableau and Microsoft Power BI have emerged as the leading BI solutions in terms of features, robust security, and cloud-first functionality, many organizations are choosing to migrate from Tableau to Power BI, including 90% of Fortune 500 companies. Tableau has been a critical modern workplace reporting tool for many organizations.

Report 52
Insiders

Sign Up for our Newsletter

This site is protected by reCAPTCHA and the Google Privacy Policy and Terms of Service apply.

article thumbnail

“Why are You Showing me That?” The Decision-Making Behind IdeaScale’s New Reporting

IdeaScale

Over the next couple of months, IdeaScale will be rolling out a suite of new reports alongside improvements to our ability to integrate with Analytics and BI tools. Upgrading our reporting has been a long-held goal of our team and we’re excited to start letting customers get their hands of the Beta version of the new tools.

Report 0
article thumbnail

The fastest way to see results from strategy execution is here

Cascade Strategy

Why, then, would we choose to build a new platform instead of simply rolling out more feature updates to our existing one? We are delivering never-before-seen capabilities and features daily, and connecting more systems and tools with stronger APIs. Report ways to mitigate these risks and their severity to all stakeholders.

article thumbnail

3 Challenges of Building Complex Dashboards with Open Source Components

Speaker: Ryan MacCarrigan, Founding Principal, LeanStudio

Many product teams use charting components and open source code libraries to get dashboards and reporting functionality quickly. But what happens when you have a growing user base and additional feature requests?

article thumbnail

2023 Rewind: Innovations and Evolutions in the Qmarkets Product Copy

Qmarkets

To kick off an exciting 2024, we’re highlighting a selection of the powerful features and updates that we launched over the last 12 months. Your users need to be able to interact and react in a seamless and engaging way, and we’re constantly adding new features to help with this. Catalyst Network Toolkit 2.0

article thumbnail

Group and Individual Learning from an Innovation Assessment

InnovationTraining.org

After spending about 10 minutes to complete the assessment on their mobile device or computer, each individual received a personalized report with their results. As the group leader, I also received a Collective Group Dashboard showing interesting insights and views of the collective group results. Notable insights.

Groups 52
article thumbnail

New Study: 2018 State of Embedded Analytics Report

We surveyed 500+ application teams embedding analytics to find out which analytics features actually move the needle. Read the 6th annual State of Embedded Analytics Report to discover new best practices. Why do some embedded analytics projects succeed while others fail? Brought to you by Logi Analytics.

article thumbnail

5 Early Indicators Your Embedded Analytics Will Fail

Many application teams leave embedded analytics to languish until something—an unhappy customer, plummeting revenue, a spike in customer churn—demands change. But by then, it may be too late. In this White Paper, Logi Analytics has identified 5 tell-tale signs your project is moving from “nice to have” to “needed yesterday.".

article thumbnail

Monetizing Analytics Features: Why Data Visualizations Will Never Be Enough

But today, dashboards and visualizations have become table stakes. Discover which features will differentiate your application and maximize the ROI of your embedded analytics. Think your customers will pay more for data visualizations in your application? Five years ago they may have. Brought to you by Logi Analytics.

article thumbnail

How to Package and Price Embedded Analytics

Just by embedding analytics, application owners can charge 24% more for their product. How much value could you add? This framework explains how application enhancements can extend your product offerings. Brought to you by Logi Analytics.

article thumbnail

Measuring Innovation Performance

Why do only a third of the organizations worldwide have formal innovation metrics in place despite accepting that innovation is critical to survival? Download this eBook to learn about the 5 basic principles that guide every successful innovation process.